Viruscraft: Genetic model connected to a tree visualisation
Posted July 28, 2017 by Dave GriffithsThe genetic model we were working on previously has now been ported into a browser compatible form and connected to a new tree visualisation that displays the species that emerge as the host population adapts to a virus infection. It's still a prototype with rough edges, but have a play with it here, some example pics:

This is one of the earlier attempts, which I like the look of, but later cleaned up versions are a bit clearer to read what is going on.
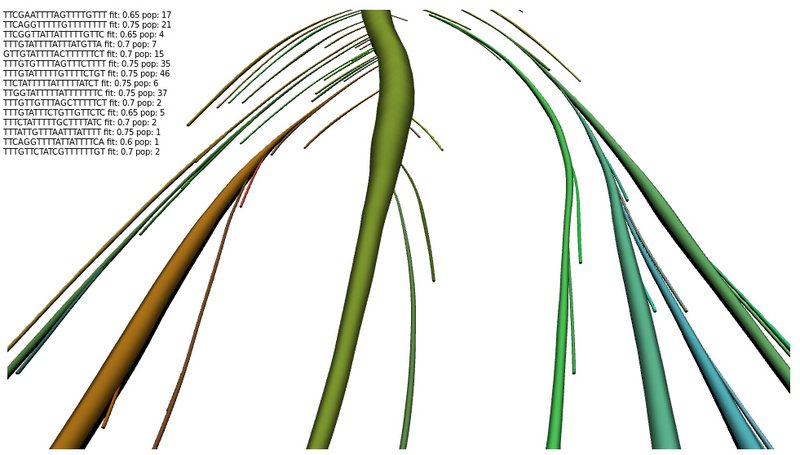
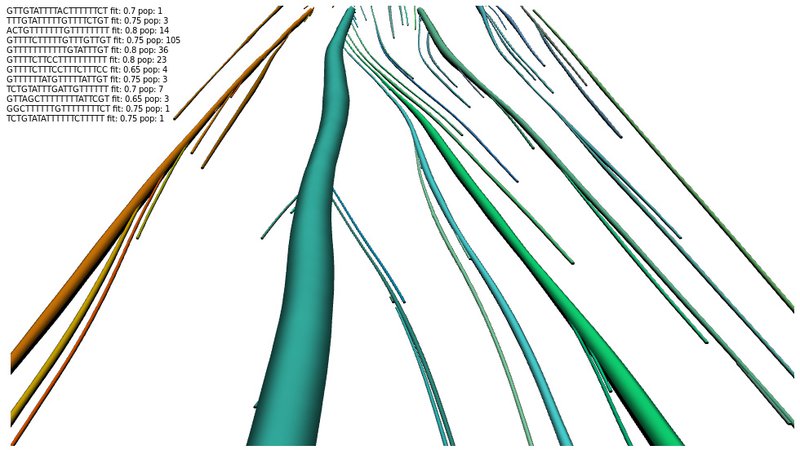
Firstly the genetic part is working in that the population evolves to get gradually better at coping with the virus infection (the fitness score increases) - it takes a bit too long at the moment, but it's great to be able to see this working in realtime as it happens with new species branching off older ones.
One early observation is that this has the potential to show why diversity is beneficial. If you modify the virus (fitness function) at a point when there are lots of different species present, the chances are that a few of them will be resilient enough to the infection to expand into the new environmental niche, and things eventually continue as before. If you alter the virus when there is only a single really well evolved species that is a bit too good at coping with the existing virus - the chances are that you will cause the population to go extinct as it won't be able to adapt. This is analogous to the situation with bananas: "To carry on growing the same genetic banana is stupid".
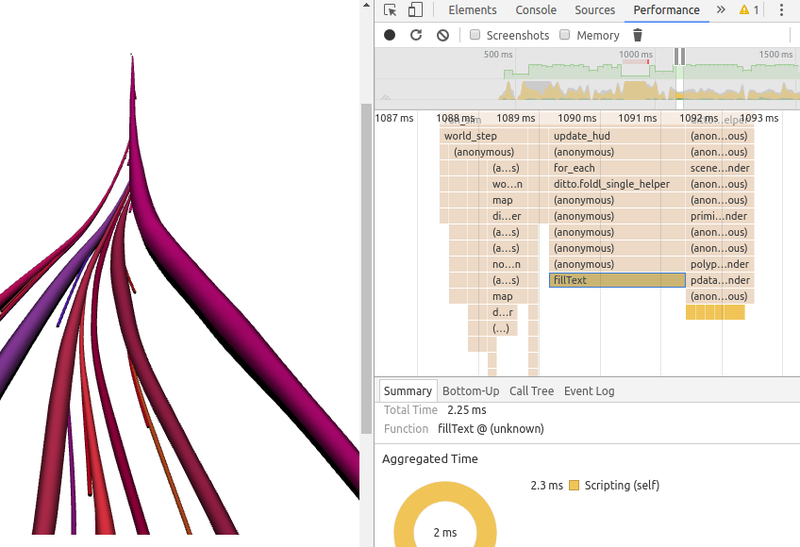
A big chunk of the work here was actually spent optimising the code. It's pretty amazing how developed browsers are for development - I've been using the profiler in the chromium browser to locate slowness and keep the frame rate as near 60 frames per second as possible. I just noticed taking the screenshot for this post the slowest single part seems to be the debug text rendering, strangely enough.
Created: 15 Jul 2021 / Updated: 15 Jul 2021